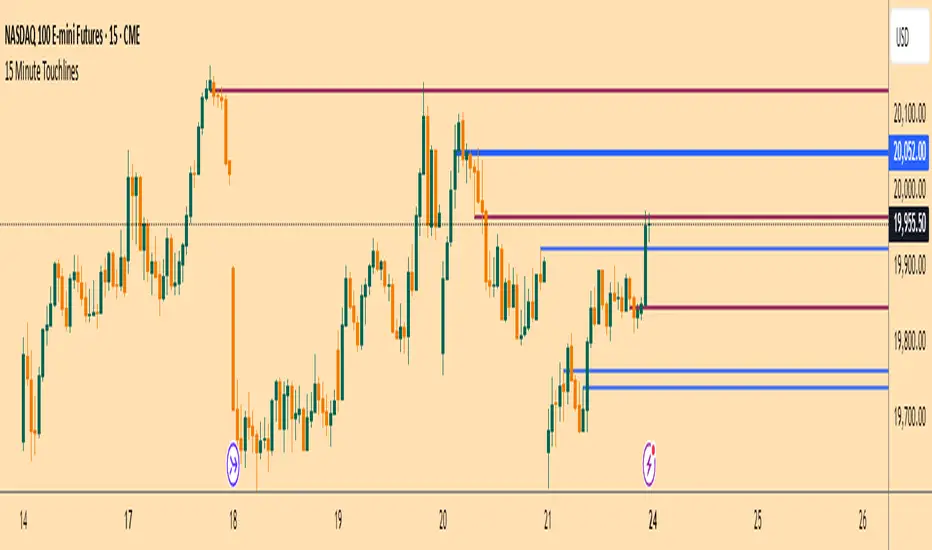
15 Minute TouchlinesThe 15 Minute Touchlines indicator is designed to identify potential breakout levels on a 15-minute timeframe, providing visual and alert-based signals for traders. This indicator overlays on the price chart and helps traders spot key levels where price may react, offering both buy and sell signals.
Key Features:
Breakout Levels:
The indicator calculates breakout levels based on recent price action, identifying potential support and resistance zones.
Up Deviation and Down Deviation parameters allow for customization of these levels.
Trend Filter:
An optional trend filter using a Simple Moving Average (SMA) can be enabled to filter out signals that do not align with the overall trend.
The trend filter helps in reducing false signals by ensuring that breakouts occur in the direction of the prevailing trend.
Visual Signals:
Lines: The indicator plots horizontal lines at identified breakout levels, which can be extended to the right.
Arrows: Optional arrows can be displayed to indicate buy or sell signals, enhancing visual clarity.
Colors: Customizable colors for buy and sell lines and arrows.
Touch Counts:
The indicator tracks the number of times price touches the plotted lines.
Users can set the number of touches required to remove a line or trigger an alert, providing flexibility in managing active levels.
Alerts:
Alerts can be configured to notify traders when price touches a line a specified number of times, aiding in timely decision-making.
Low Pass Bands:
The indicator incorporates low pass bands to smooth out price fluctuations, helping to identify more reliable breakout levels.
Customizable parameters for the low pass bands allow traders to fine-tune the indicator's sensitivity.
Input Parameters:
History Lines to Show: Number of historical lines to display.
Show Lines: Toggle to display or hide the breakout lines.
Touches to Remove Line: Number of touches required to remove a line.
Touch Number for Alert: Number of touches required to trigger an alert.
Buy/Sell Line Color: Custom colors for buy and sell lines.
Up/Down Deviation: Deviation factors for calculating breakout levels.
Extend Lines to Right: Option to extend lines to the right edge of the chart.
Line Thickness: Thickness of the plotted lines.
Use Trend SMA Filter: Toggle to enable or disable the trend filter.
Trend SMA Period: Period for the trend SMA filter.
Usage:
Identify Breakouts: Use the plotted lines and arrows to identify potential breakout levels and direction.
Trend Confirmation: Enable the trend filter to ensure that breakouts align with the overall trend.
Alert Management: Set up alerts to be notified of price interactions with key levels, aiding in active trading strategies.
The 15 Minute Touchlines indicator is a versatile tool for traders looking to capitalize on short-term price movements, offering a blend of visual signals and customizable alerts to enhance trading decisions.
Search in scripts for "Up down"
Combined Up down with volumeThis indicator plots a purple dot 🟣 when a stock moves up or down by 5% or more with a minimum volume of 500,000.
✅ You can customize the volume and percentage settings to fit your trading style.
📌 More dots = High volatility & liquidity
📌 Fewer dots = Slow-moving stock
Perfect for spotting fast-moving opportunities!

Volume Profile & Smart Money Explorer🔍 Volume Profile & Smart Money Explorer: Decode Institutional Footprints
Master the art of institutional trading with this sophisticated volume analysis tool. Track smart money movements, identify peak liquidity windows, and align your trades with major market participants.
🌟 Key Features:
📊 Triple-Layer Volume Analysis
• Total Volume Patterns
• Directional Volume Split (Up/Down)
• Institutional Flow Detection
• Real-time Smart Money Tracking
• Historical Pattern Recognition
⚡ Smart Money Detection
• Institutional Trade Identification
• Large Block Order Tracking
• Smart Money Concentration Periods
• Whale Activity Alerts
• Volume Threshold Analysis
📈 Advanced Profiling
• Hourly Volume Distribution
• Directional Bias Analysis
• Liquidity Heat Maps
• Volume Pattern Recognition
• Custom Threshold Settings
🎯 Strategic Applications:
Institutional Trading:
• Track Big Player Movements
• Identify Accumulation/Distribution
• Follow Smart Money Flow
• Detect Institutional Trading Windows
• Monitor Block Orders
Risk Management:
• Identify High Liquidity Windows
• Avoid Thin Market Periods
• Optimize Position Sizing
• Track Market Participation
• Monitor Volume Quality
Market Analysis:
• Volume Pattern Recognition
• Smart Money Flow Analysis
• Liquidity Window Identification
• Institutional Activity Cycles
• Market Depth Analysis
💡 Perfect For:
• Professional Traders
• Volume Profile Traders
• Institutional Traders
• Risk Managers
• Algorithmic Traders
• Smart Money Followers
• Day Traders
• Swing Traders
📊 Key Metrics:
• Normalized Volume Profiles
• Institutional Thresholds
• Directional Volume Split
• Smart Money Concentration
• Historical Patterns
• Real-time Analysis
⚡ Trading Edge:
• Trade with Institution Flow
• Identify Optimal Entry Points
• Recognize Distribution Patterns
• Follow Smart Money Positioning
• Avoid Thin Markets
• Capitalize on Peak Liquidity
🎓 Educational Value:
• Understand Market Structure
• Learn Volume Analysis
• Master Institutional Patterns
• Develop Market Intuition
• Track Smart Money Flow
🛠️ Customization:
• Adjustable Time Windows
• Flexible Volume Thresholds
• Multiple Timeframe Analysis
• Custom Alert Settings
• Visual Preference Options
Whether you're tracking institutional flows in crypto markets or following smart money in traditional markets, the Volume Profile & Smart Money Explorer provides the deep insights needed to trade alongside the biggest players.
Transform your trading from retail guesswork to institutional precision. Know exactly when and where smart money moves, and position yourself ahead of major market shifts.
#VolumeProfile #SmartMoney #InstitutionalTrading #MarketAnalysis #TradingView #VolumeAnalysis #CryptoTrading #ForexTrading #TechnicalAnalysis #Trading #PriceAction #MarketStructure #OrderFlow #Liquidity #RiskManagement #TradingStrategy #DayTrading #SwingTrading #AlgoTrading #QuantitativeTrading

Volume Profile [ActiveQuants]The Volume Profile indicator visualizes the distribution of trading volume across price levels over a user-defined historical period. It identifies key liquidity zones, including the Point of Control (POC) (price level with the highest volume) and the Value Area (price range containing a specified percentage of total volume). This tool is ideal for traders analyzing support/resistance levels, market sentiment , and potential price reversals .
█ CORE METHODOLOGY
Vertical Price Rows: Divides the price range of the selected lookback period into equal-height rows.
Volume Aggregation: Accumulates bullish/bearish or total volume within each price row.
POC: The row with the highest total volume.
Value Area: Expands from the POC until cumulative volume meets the user-defined threshold (e.g., 70%).
Dynamic Visualization: Rows are plotted as horizontal boxes with widths proportional to their volume.
█ KEY FEATURES
- Customizable Lookback & Resolution
Adjust the historical period ( Lookback ) and granularity ( Number of Rows ) for precise analysis.
- Configurable Profile Width & Horizontal Offset
Control the relative horizontal length of the profile rows, and set the distance from the current bar to the POC row’s anchor.
Important: Do not set the horizontal offset too high. Indicators cannot be plotted more than 500 bars into the future.
- Value Area & POC Highlighting
Set the percentage of total volume required to form the Value Area , ensuring that key volume levels are clearly identified.
Value Area rows are colored distinctly, while the POC is marked with a bold line.
- Flexible Display Options
Show bullish/bearish volume splits or total volume.
Place the profile on the right or left of the chart.
- Gradient Coloring
Rows fade in color intensity based on their relative volume strength .
- Real-Time Adjustments
Modify horizontal offset, profile width, and appearance without reloading.
█ USAGE EXAMPLES
Example 1: Basic Volume Profile with Value Area
Settings:
Lookback: 500 bars
Number of Rows: 100
Value Area: 70%
Display Type: Up/Down
Placement: Right
Image Context:
The profile appears on the right side of the chart. The POC (orange line) marks the highest volume row. Value Area rows (green/red) extend above/below the POC, containing 70% of total volume.
Example 2: Total Volume with Gradient Colors
Settings:
Lookback: 800 bars
Number of Rows: 100
Profile Width: 60
Horizontal Offset: 20
Display Type: Total
Gradient Colors: Enabled
Image Context:
Rows display total volume in a single color with gradient transparency. Darker rows indicate higher volume concentration.
Example 3: Left-Aligned Profile with Narrow Value Area
Settings:
Lookback: 600 bars
Number of Rows: 100
Profile Width: 45
Horizontal Offset: 500
Value Area: 50%
Profile Placement: Left
Image Context:
The profile shifts to the left, with a tighter Value Area (50%).
█ USER INPUTS
Calculation Settings
Lookback: Historical bars analyzed (default: 500).
Number of Rows: Vertical resolution of the profile (default: 100).
Profile Width: Horizontal length of rows (default: 50).
Horizontal Offset: Distance from the current bar to the POC (default: 50).
Value Area (%): Cumulative volume threshold for the Value Area (default: 70%).
Volume Display: Toggle between Up/Down (bullish/bearish) or Total volume.
Profile Placement: Align profile to the Right or Left of the chart.
Appearance
Rows Border: Customize border width/color.
Gradient Colors: Enable fading color effects.
Value Area Colors: Set distinct colors for bullish and bearish Value Area rows.
POC Line: Adjust color, width, and visibility.
█ CONCLUSION
The Volume Profile indicator provides a dynamic, customizable view of market liquidity. By highlighting the POC and Value Area, traders can identify high-probability reversal zones, gauge market sentiment, and align entries/exits with key volume levels.
█ IMPORTANT NOTES
⚠ Lookback Period: Shorter lookbacks prioritize recent activity but may omit critical levels.
⚠ Horizontal Offset Limitation: Avoid excessively high offsets (e.g., close to ±300). TradingView restricts plotting indicators more than 500 bars into the future, which may truncate or hide the profile.
⚠ Risk Management: While the indicator highlights areas of concentrated volume, always use it in combination with other technical analysis tools and proper risk management techniques.
█ RISK DISCLAIMER
Trading involves substantial risk. The Volume Profile highlights historical liquidity but does not predict future price movements. Always use stop-loss orders and confirm signals with additional analysis. Past performance is not indicative of future results.
📊 Happy trading! 🚀

PVSRA Volume Suite with Volume DeltaPVSRA Volume Suite with Volume Delta
🔹 Overview
This indicator is a Volume Suite that enhances PVSRA (Price, Volume, Support, Resistance Analysis) by incorporating Volume Delta and AI-driven predictive alerts. It is designed to help traders analyze volume pressure, market trends, and price movements with color-coded visualizations.
📌 Key Features
PVSRA Volume Color Coding – Highlights vector candles based on extreme volume/spread conditions.
Volume Delta Analysis – Tracks buying/selling pressure using up/down volume data.
AI-Powered Predictive Alerts – Identifies potential trend shifts based on volume and trend context.
Volatility-Adjusted Thresholds – Dynamically adapts volume conditions based on ATR (Average True Range).
Customizable MA & Symbol Overrides – Allows traders to tweak settings for personalized market insights.
Debug & Diagnostic Labels – Shows statistical z-scores, thresholds, and volume dynamics.
How It Works
PVSRA Color Coding – The script classifies candles into four categories based on volume and spread analysis:
🔴 Red Vector → Extreme bearish volume/spread
🟢 Green Vector → Extreme bullish volume/spread
🟣 Violet Vector → Above-average bearish volume
🔵 Blue Vector → Above-average bullish volume
Volume Delta Calculation – Uses lower timeframe volume analysis to estimate up/down volume differentials.
Trend & Predictive Alerts – Combines EMA crossovers with statistical volume analysis to detect potential trend shifts.
Volatility Adaptation – Adjusts volume thresholds based on ATR, making signals more reliable in changing market conditions.
Custom Symbol Override – Fetches PVSRA data from a different instrument, useful for index-based volume analysis.
Customizable Inputs
PVSRA Color Settings – Modify candle color schemes for better visual clarity.
Volume Delta Colors – Customize delta volume body, wick, and border colors.
AI Settings – Tune z-score thresholds, lookback periods, and enable predictive alerts.
Symbol Overrides – Analyze volume from a different market or asset.
Moving Average (MA) Settings – Display a volume-based moving average for trend confirmation.
Important Notes
Works best on intraday timeframes where volume data is reliable.
Lower timeframe volume delta estimates might not be precise for all assets.
No guarantees of accuracy – Use alongside other confluence tools for decision-making.
Credits & Open-Source Notice
This script is based on PVSRA methodologies and integrates Volume Delta analysis. Special thanks to Traders Reality and TradingView for their contributions to volume-based analysis.

MMM MARKET CHAOS TO CLARITY INTELLIGENCE @MaxMaserati# MMM MARKET CHAOS TO CLARITY INTELLIGENCE
## Overview
The MMM MARKET CHAOS TO CLARITY INTELLIGENCE (MMM AI Pro) by MaxMaserati is a sophisticated multi-factor analysis tool that provides comprehensive market insights through a unified dashboard. This system integrates several proprietary components to detect market conditions, trends, and potential reversals.
At its core, this indicator is designed to bring clarity to market complexity by identifying meaningful patterns and establishing order within what often appears as random market chaos
The MMM Intelligence Matrix accomplishes this through its multi-layered approach:
- The MMPD system quantifies market conditions on a clear 0-100 scale, transforming complex price movements into actionable premium/discount levels
- The proprietary candle analysis (MMMC Bias) identifies specific patterns with predictive value
- The integration of volume, momentum, and multi-timeframe analysis creates a comprehensive market context
- The Hot/Cold classification system helps traders distinguish between sustainable moves and overextended conditions
What makes this indicator particularly valuable is how it synthesizes multiple technical factors into clear visual signals and classifications. Instead of leaving traders to interpret numerous conflicting indicators, it presents an organized dashboard of market conditions with straightforward action zones.
## Core Components
### MMPD (Max Maserati Premium and Discount)
- Normalizes price movement on a 0-100 scale:
- **Premium (>50)**: Bullish conditions
- **Discount (<50)**: Bearish conditions
- **Extreme values (>90 or <10)**: Potential reversal zones
### MMMC (Max Maserati Model Candle) Bias
- Analyzes candle patterns to predict behavior:
- **Bullish/Bearish Body Close**: Price closes beyond previous candle's high/low
- **Bullish/Bearish Affinity**: Shows tendency toward continuation
- **Seek & Destroy**: Tests previous levels then breaks in new direction
- **Close Inside**: Closes within previous candle's range with directional bias
- **Plus/Minus**: Indicates slight tendency toward bulls/bears
### PC Strength (Previous Candle Strength)
- Measures percentage power of recent candlesticks
- Analyzes strength across multiple previous candles (PC1, PC2, PC3)
### MVM (Market Volatility Momentum)
- Adaptive moving averages system analyzing multiple timeframes:
- **Short context (8 bars)**: Immediate direction
- **Medium context (21 bars)**: Intermediate validation
- **Long context (55 bars)**: Primary trend confirmation
- **Higher timeframe**: Additional confirmation
### Volume Intelligence System
- Adaptive algorithm comparing current volume to 20-period average
- Identifies significant volume events and thresholds
### Hot/Cold Momentum Classification
- **Strong Bullish/Bearish (Hot)**: Potentially overextended
- **Strong Bullish/Bearish (Cold)**: Strong with room to continue
- **Bullish/Bearish Momentum**: Clear directional bias
- **Mild Bullish/Bearish**: Weak directional bias
### HVC (Highest Volume Candles) Detection
- Triangle markers and sequential stars indicate significant volume-confirmed movements
- Signals potential trend changes and continuation setups
## Dashboard Interface
The customizable dashboard displays:
1. **MMMC Bias**: Candle pattern analysis and direction
2. **Delta MA**: Buy/sell pressure with directional arrows
3. **PC Strength**: Percentage strength of previous candles
4. **Current Trend**: Overall market bias state
5. **MMPD Bias**: Premium/discount context
6. **Short/Medium/Long Term**: Price change percentages
7. **Trend Quality**: Reliability rating
8. **Volume Strength**: Classification (High/Medium/Low)
9. **MMPD Values**: Current level with direction indicator
10. **HTF Trend**: Higher timeframe confirmation
11. **Trend Strength**: Overall momentum measurement
12. **Action Zone**: Trading zone classification
13. **Momentum Strength**: Hot/Cold status
## MMPD Value Classifications
- **EXTREME PREMIUM (>90) ⚠️**: Extremely overbought
- **HIGH PREMIUM (80-90) ↗**: Strong bullish (caution)
- **PREMIUM (65-80) ↗**: Healthy bullish zone
- **LIGHT PREMIUM (50-65) →**: Mild bullish territory
- **LIGHT DISCOUNT (35-50) →**: Mild bearish territory
- **DISCOUNT (20-35) ↘**: Healthy bearish zone
- **HIGH DISCOUNT (10-20) ↘**: Strong bearish (caution)
- **EXTREME DISCOUNT (<10) ⚠️**: Extremely oversold
## Action Zone Classifications
- **MASSIVE BUY/SELL ZONE ★★★**: Very strong bias (Strength >5.0)
- **STRONG BUY/SELL ZONE ★★**: Strong bias (Strength >3.0)
- **MEDIUM BUY/SELL ZONE ★**: Moderate bias (Strength >2.0)
- **LIGHT BUY/SELL ZONE ⋆**: Mild bias (Strength >1.0)
- **SUPER LIGHT BUY/SELL ZONE ·**: Weak bias (Strength <1.0)
- **NEUTRAL ZONE**: No clear directional bias
## Visual Signals
1. **Triangle Markers**: HVC system directional signals (up/down)
2. **Sequential Stars (★)**: Advanced confirmation signals following trend changes
3. **High Volume Highlighting**: Optional candle emphasis for volume events
## Entry Conditions
### Strong Buy Setup
- MMPD Values: PREMIUM or LIGHT PREMIUM
- Hot/Cold Status: "⚠️ Strong Bullish (Cold)" or "↗️ Bullish Momentum"
- Action Zone: MASSIVE or STRONG BUY ZONE
- Volume Strength: High or Medium
- Current Trend: Strong Bullish or Bullish
### Strong Sell Setup
- MMPD Values: DISCOUNT or LIGHT DISCOUNT
- Hot/Cold Status: "⚠️ Strong Bearish (Cold)" or "↘️ Bearish Momentum"
- Action Zone: MASSIVE or STRONG SELL ZONE
- Volume Strength: High or Medium
- Current Trend: Strong Bearish or Bearish
## Exit Conditions
### Exit Long Positions When
- Hot/Cold Status changes to "⚠️ Strong Bullish (Hot)" or "↘️ Bearish Momentum"
- MMPD Values shows EXTREME PREMIUM or HIGH PREMIUM
- Action Zone changes to NEUTRAL ZONE or any SELL ZONE
- Current Trend shows "Bearish Reversal" or "Exiting Overbought"
### Exit Short Positions When
- Hot/Cold Status changes to "⚠️ Strong Bearish (Hot)" or "↗️ Bullish Momentum"
- MMPD Values shows EXTREME DISCOUNT or HIGH DISCOUNT
- Action Zone changes to NEUTRAL ZONE or any BUY ZONE
- Current Trend shows "Bullish Reversal" or "Exiting Oversold"
## Position Sizing Guidelines
- **Full Position (100%)**: Action Zone ★★★/★★, normal momentum, High volume
- **Reduced Position (50-75%)**: "Cold" signal, Action Zone ★, Medium volume
- **Small Position (25-50%)**: Action Zone ⋆, Medium/Low volume, mixed signals
- **No Position**: "Hot" signal, NEUTRAL zone, Low volume
## Special Trade Setups
### Reversal Setups
- **Bullish Reversal**: Transition from EXTREME DISCOUNT, Hot→Cold change, emerging buy signal, high volume
- **Bearish Reversal**: Transition from EXTREME PREMIUM, Hot→Cold change, emerging sell signal, high volume
### Continuation Setups
- **Bullish Continuation**: PREMIUM range, "Cold" signal, strong volume, timeframe alignment, clear Action Zone
- **Bearish Continuation**: DISCOUNT range, "Cold" signal, strong volume, timeframe alignment, clear Action Zone
## Sequential Stars System
- **Sequential Buy Signal**: Bullish star after bearish trend, volume confirmation
- **Sequential Sell Signal**: Bearish star after bullish trend, volume confirmation
## Best Practices
- Check multiple timeframes (prioritize when all align)
- Validate with volume (High >2.5x, Medium >1.2x)
- Assess trend quality (Strong ★★★, Confirmed ★★, Warning ⚠, Transition ↕)
- Handle inside bars/consolidation with additional confirmation
## Technical Considerations
- Based on closed candles for calculations
- Requires reliable volume data
- Higher sensitivity settings may produce more frequent signals
- Extreme readings indicate potential turning points
- Sequential stars require proper trend changes for activation
## Indicator Applicability
- **Markets**: Forex, Crypto, Stocks, Futures, Commodities
- **Timeframes**: 1H+ recommended, 4H/Daily for primary analysis
*Intended for use with the full MMM system. Trading decisions require proper knowledge and risk management.*

Volume Delta & Order Block Suite [QuantAlgo]Upgrade your volume analysis and order flow trading with Volume Delta & Order Block Suite by QuantAlgo, a sophisticated technical indicator that leverages advanced volume delta calculations, along with dynamic order block detection to provide deep insights into market participant behavior. By calculating the distribution of volume between buyers and sellers and tracking pivotal volume zones, the indicator helps traders understand the underlying forces driving price movements. It is particularly valuable for those looking to identify high-probability trading opportunities based on volume imbalances and key price levels where significant activity has occurred.
🟢 Technical Foundation
The Volume Delta & Order Block Suite utilizes sophisticated volume analysis techniques to estimate buying and selling pressure within each price candle. The core volume delta calculation employs a formula that estimates buy volume as: Volume × (Close - Low) ÷ (High - Low) , with sell volume calculated as the remainder of total volume. This approach assumes that when price closes near the high of a candle, most volume represents buying pressure, and when price closes near the low, most volume represents selling pressure.
For order block detection, the indicator implements a multi-step process involving volume pivot identification and price state tracking. It first detects significant volume pivot points using the ta.pivothigh function with a user-defined pivot period. It then tracks the market's order state based on whether the high exceeds the highest high or the low falls below the lowest low. When a volume pivot occurs, the indicator creates order blocks based on price levels at that pivot point. These blocks are continuously monitored for invalidation based on subsequent price action.
🟢 Key Features & Signals
1. Volume Delta Representation on Candles
The Volume Delta visualization on candles shows the buy/sell distribution directly on price bars, creating an immediate visual representation of volume pressure.
When buyers are dominant, candles are colored with the bullish theme color (default: green/teal).
Similarly, when sellers are dominant, candles are colored with the bearish theme color (default: red).
This visualization provides immediate insights into underlying volume pressure without requiring separate indicators, helping traders quickly identify which side of the market is in control.
2. Buy/Sell Pressure Information Table
The Volume Analysis Table provides a comprehensive breakdown of volume metrics across multiple timeframes, helping traders identify shifts in market behavior.
The table is organized into four timeframe columns:
Current Volume
1 Bar Before
1 Day Before
1 Week Before
For each timeframe, the table displays:
Buy volume: The estimated buying volume based on price action
Sell volume: The estimated selling volume based on price action
Total volume: The sum of buy and sell volume
Delta: The difference between buy and sell volume (positive when buyers are dominant, negative when sellers are dominant)
Additionally, the table shows both absolute values and percentage distributions, with trend indicators (Up, Down, or Neutral) at the bottom row of each timeframe column.
This multi-timeframe approach helps traders:
→ Identify volume imbalances between buyers and sellers
→ Track changes in volume delta across different periods
→ Compare current conditions with historical patterns
→ Detect potential reversals by watching for shifts in delta direction
The delta values are particularly useful as they provide a clear indication of market dominance – positive delta (Up) when buyers are dominant, and negative delta (Down) when sellers are dominant.
3. Order Blocks and Their Confluence
Order blocks represent significant price zones where volume pivots occur, potentially indicating areas of significant market participant activity.
The indicator identifies two types of order blocks:
Bullish Order Blocks (support): Highlighted with a green/teal color, these represent potential support areas where price might bounce when revisited
Bearish Order Blocks (resistance): Highlighted with a red color, these represent potential resistance areas where price might reverse when revisited
Each order block is visualized as a colored rectangle with a dashed line showing the average price within the block. The blocks are extended to the right until they are invalidated.
Order blocks can serve as key reference points for trading decisions, for example:
Support/resistance identification
Stop loss placement (beyond the opposite edge of the block)
Potential reversal zones
Target areas for profit-taking
When price approaches an order block, traders should look for confluence with the volume delta on candles and the information in the volume analysis table. Strong setups occur when all three components align – for example, when price approaches a bearish order block with increasing sell volume shown on the candles and in the volume table.
🟢 Practical Usage Tips
→ Volume Analysis and Interpretation: The indicator visualizes the buy/sell volume ratio directly on price candles using color intensity, allowing traders to immediately identify which side (buyers or sellers) is dominant. This information helps in assessing the strength behind price movements and potential continuation or reversal signals.
→ Order Block Trading Strategies: The indicator highlights significant price zones where volume pivots occur, marking these as potential support (bullish order blocks) or resistance (bearish order blocks). Traders can use these levels to identify potential reversal points, stop placement, and profit targets.
→ Multi-timeframe Volume Comparison: Through its comprehensive volume analysis table, the indicator enables traders to compare volume patterns across current, recent, daily, and weekly timeframes. This helps in identifying shifts in market behavior and confirming the strength of ongoing trends.
🟢 Pro Tips
Adjust Pivot Period based on your timeframe:
→ Lower values (3-5) for more frequent order blocks
→ Higher values (7-10) for stronger, less frequent order blocks
Fine-tune Mitigation Method based on your trading style:
→ "Wick" for more conservative invalidation
→ "Close" for more lenient order block survival
Look for confluence between components:
→ Strong volume delta in the expected direction when price touches an order block
→ Corresponding patterns in the volume analysis table
→ Overall market context aligning with the expected direction
Use for multiple trading approaches:
→ Support/resistance trading at order blocks
→ Trend confirmation with volume delta
→ Reversal detection when volume delta changes direction
→ Stop loss placement using order block boundaries
Combine with:
→ Trend analysis using trend-following indicators for trade confirmation
→ Multiple timeframe analysis for strategic context

MMM MARKET CHAOS TO CLARITY INTELLIGENCE @MaxMaserati# MMM MARKET CHAOS TO CLARITY INTELLIGENCE
## Overview
The MMM MARKET CHAOS TO CLARITY INTELLIGENCE (MMM AI Pro) by MaxMaserati is a sophisticated multi-factor analysis tool that provides comprehensive market insights through a unified dashboard. This system integrates several proprietary components to detect market conditions, trends, and potential reversals.
At its core, this indicator is designed to bring clarity to market complexity by identifying meaningful patterns and establishing order within what often appears as random market chaos
The MMM Intelligence Matrix accomplishes this through its multi-layered approach:
- The MMPD system quantifies market conditions on a clear 0-100 scale, transforming complex price movements into actionable premium/discount levels
- The proprietary candle analysis (MMMC Bias) identifies specific patterns with predictive value
- The integration of volume, momentum, and multi-timeframe analysis creates a comprehensive market context
- The Hot/Cold classification system helps traders distinguish between sustainable moves and overextended conditions
What makes this indicator particularly valuable is how it synthesizes multiple technical factors into clear visual signals and classifications. Instead of leaving traders to interpret numerous conflicting indicators, it presents an organized dashboard of market conditions with straightforward action zones.
## Core Components
### MMPD (Max Maserati Premium and Discount)
- Normalizes price movement on a 0-100 scale:
- **Premium (>50)**: Bullish conditions
- **Discount (<50)**: Bearish conditions
- **Extreme values (>90 or <10)**: Potential reversal zones
### MMMC (Max Maserati Model Candle) Bias
- Analyzes candle patterns to predict behavior:
- **Bullish/Bearish Body Close**: Price closes beyond previous candle's high/low
- **Bullish/Bearish Affinity**: Shows tendency toward continuation
- **Seek & Destroy**: Tests previous levels then breaks in new direction
- **Close Inside**: Closes within previous candle's range with directional bias
- **Plus/Minus**: Indicates slight tendency toward bulls/bears
### PC Strength (Previous Candle Strength)
- Measures percentage power of recent candlesticks
- Analyzes strength across multiple previous candles (PC1, PC2, PC3)
### MVM (Market Volatility Momentum)
- Adaptive moving averages system analyzing multiple timeframes:
- **Short context (8 bars)**: Immediate direction
- **Medium context (21 bars)**: Intermediate validation
- **Long context (55 bars)**: Primary trend confirmation
- **Higher timeframe**: Additional confirmation
### Volume Intelligence System
- Adaptive algorithm comparing current volume to 20-period average
- Identifies significant volume events and thresholds
### Hot/Cold Momentum Classification
- **Strong Bullish/Bearish (Hot)**: Potentially overextended
- **Strong Bullish/Bearish (Cold)**: Strong with room to continue
- **Bullish/Bearish Momentum**: Clear directional bias
- **Mild Bullish/Bearish**: Weak directional bias
### HVC (Highest Volume Candles) Detection
- Triangle markers and sequential stars indicate significant volume-confirmed movements
- Signals potential trend changes and continuation setups
## Dashboard Interface
The customizable dashboard displays:
1. **MMMC Bias**: Candle pattern analysis and direction
2. **Delta MA**: Buy/sell pressure with directional arrows
3. **PC Strength**: Percentage strength of previous candles
4. **Current Trend**: Overall market bias state
5. **MMPD Bias**: Premium/discount context
6. **Short/Medium/Long Term**: Price change percentages
7. **Trend Quality**: Reliability rating
8. **Volume Strength**: Classification (High/Medium/Low)
9. **MMPD Values**: Current level with direction indicator
10. **HTF Trend**: Higher timeframe confirmation
11. **Trend Strength**: Overall momentum measurement
12. **Action Zone**: Trading zone classification
13. **Momentum Strength**: Hot/Cold status
## MMPD Value Classifications
- **EXTREME PREMIUM (>90) ⚠️**: Extremely overbought
- **HIGH PREMIUM (80-90) ↗**: Strong bullish (caution)
- **PREMIUM (65-80) ↗**: Healthy bullish zone
- **LIGHT PREMIUM (50-65) →**: Mild bullish territory
- **LIGHT DISCOUNT (35-50) →**: Mild bearish territory
- **DISCOUNT (20-35) ↘**: Healthy bearish zone
- **HIGH DISCOUNT (10-20) ↘**: Strong bearish (caution)
- **EXTREME DISCOUNT (<10) ⚠️**: Extremely oversold
## Action Zone Classifications
- **MASSIVE BUY/SELL ZONE ★★★**: Very strong bias (Strength >5.0)
- **STRONG BUY/SELL ZONE ★★**: Strong bias (Strength >3.0)
- **MEDIUM BUY/SELL ZONE ★**: Moderate bias (Strength >2.0)
- **LIGHT BUY/SELL ZONE ⋆**: Mild bias (Strength >1.0)
- **SUPER LIGHT BUY/SELL ZONE ·**: Weak bias (Strength <1.0)
- **NEUTRAL ZONE**: No clear directional bias
## Visual Signals
1. **Triangle Markers**: HVC system directional signals (up/down)
2. **Sequential Stars (★)**: Advanced confirmation signals following trend changes
3. **High Volume Highlighting**: Optional candle emphasis for volume events
## Entry Conditions
### Strong Buy Setup
- MMPD Values: PREMIUM or LIGHT PREMIUM
- Hot/Cold Status: "⚠️ Strong Bullish (Cold)" or "↗️ Bullish Momentum"
- Action Zone: MASSIVE or STRONG BUY ZONE
- Volume Strength: High or Medium
- Current Trend: Strong Bullish or Bullish
### Strong Sell Setup
- MMPD Values: DISCOUNT or LIGHT DISCOUNT
- Hot/Cold Status: "⚠️ Strong Bearish (Cold)" or "↘️ Bearish Momentum"
- Action Zone: MASSIVE or STRONG SELL ZONE
- Volume Strength: High or Medium
- Current Trend: Strong Bearish or Bearish
## Exit Conditions
### Exit Long Positions When
- Hot/Cold Status changes to "⚠️ Strong Bullish (Hot)" or "↘️ Bearish Momentum"
- MMPD Values shows EXTREME PREMIUM or HIGH PREMIUM
- Action Zone changes to NEUTRAL ZONE or any SELL ZONE
- Current Trend shows "Bearish Reversal" or "Exiting Overbought"
### Exit Short Positions When
- Hot/Cold Status changes to "⚠️ Strong Bearish (Hot)" or "↗️ Bullish Momentum"
- MMPD Values shows EXTREME DISCOUNT or HIGH DISCOUNT
- Action Zone changes to NEUTRAL ZONE or any BUY ZONE
- Current Trend shows "Bullish Reversal" or "Exiting Oversold"
## Position Sizing Guidelines
- **Full Position (100%)**: Action Zone ★★★/★★, normal momentum, High volume
- **Reduced Position (50-75%)**: "Cold" signal, Action Zone ★, Medium volume
- **Small Position (25-50%)**: Action Zone ⋆, Medium/Low volume, mixed signals
- **No Position**: "Hot" signal, NEUTRAL zone, Low volume
## Special Trade Setups
### Reversal Setups
- **Bullish Reversal**: Transition from EXTREME DISCOUNT, Hot→Cold change, emerging buy signal, high volume
- **Bearish Reversal**: Transition from EXTREME PREMIUM, Hot→Cold change, emerging sell signal, high volume
### Continuation Setups
- **Bullish Continuation**: PREMIUM range, "Cold" signal, strong volume, timeframe alignment, clear Action Zone
- **Bearish Continuation**: DISCOUNT range, "Cold" signal, strong volume, timeframe alignment, clear Action Zone
## Sequential Stars System
- **Sequential Buy Signal**: Bullish star after bearish trend, volume confirmation
- **Sequential Sell Signal**: Bearish star after bullish trend, volume confirmation
## Best Practices
- Check multiple timeframes (prioritize when all align)
- Validate with volume (High >2.5x, Medium >1.2x)
- Assess trend quality (Strong ★★★, Confirmed ★★, Warning ⚠, Transition ↕)
- Handle inside bars/consolidation with additional confirmation
## Technical Considerations
- Based on closed candles for calculations
- Requires reliable volume data
- Higher sensitivity settings may produce more frequent signals
- Extreme readings indicate potential turning points
- Sequential stars require proper trend changes for activation
## Indicator Applicability
- **Markets**: Forex, Crypto, Stocks, Futures, Commodities
- **Timeframes**: 1H+ recommended, 4H/Daily for primary analysis
*Intended for use with the full MMM system. Trading decisions require proper knowledge and risk management.*

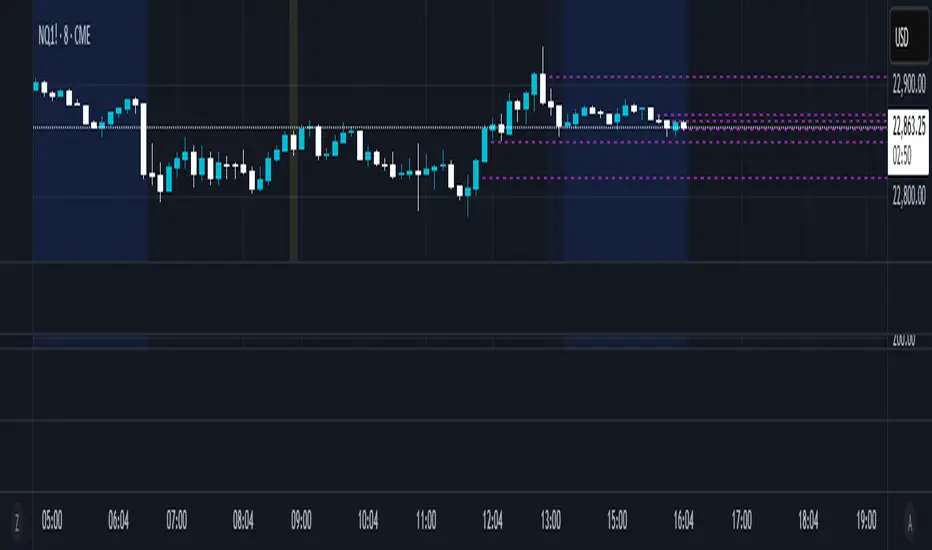
Half Candle RetraceThis custom indicator draws a horizontal line at the 50% retracement level of each candlestick on the chart. It calculates the midpoint between the high and low of each candle, which is often used by traders to identify potential entry, exit and take-profit levels. Once price action returns to an untouched level, the line will be removed, leaving only the levels where price action is still missing.
Key Features:
Timeframe: Works on all timeframes.
Line Color: Customize the line color to suit your charting preferences.
Line Width: Adjust the thickness of the retracement line for better visibility.
Line Style: Choose between solid, dotted, or dashed lines.
Up/Down Candle Selection: Option to only display retracement lines for up (bullish) candles, down (bearish) candles, or both.
Full Customization: Control the transparency (opacity) of the line for enhanced visual clarity.
Simple Setup: No complicated settings – simply choose your preferred color, line style, and visibility options.
This indicator is perfect for traders who prefer to use price action and retracement levels to identify potential trade opportunities.
How It Works:
The indicator automatically calculates the 50% level (midpoint) for each candlestick, drawing a line at this level. It will only draw lines for candles that match your chosen criteria (up or down candles), ensuring the chart remains clean and relevant to your trading strategy. Lines are automatically removed as soon as price crosses them.
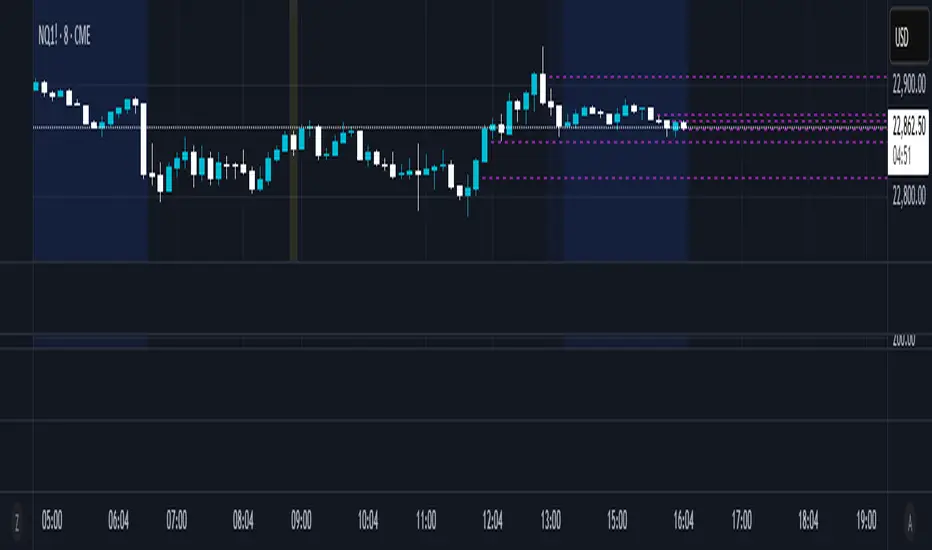
50% Candle RetraceThis custom indicator draws a horizontal line at the 50% retracement level of each candlestick on the chart. It calculates the midpoint between the high and low of each candle, which is often used by traders to identify potential entry, exit and take-profit levels. Once price action returns to an untouched level, the line will be removed, leaving only the levels where price action is still missing.
Key Features:
Timeframe: Works on all timeframes.
Line Color: Customize the line color to suit your charting preferences.
Line Width: Adjust the thickness of the retracement line for better visibility.
Line Style: Choose between solid, dotted, or dashed lines.
Up/Down Candle Selection: Option to only display retracement lines for up (bullish) candles, down (bearish) candles, or both.
Full Customization: Control the transparency (opacity) of the line for enhanced visual clarity.
Simple Setup: No complicated settings – simply choose your preferred color, line style, and visibility options.
This indicator is perfect for traders who prefer to use price action and retracement levels to identify potential trade opportunities.
How It Works:
The indicator automatically calculates the 50% level (midpoint) for each candlestick, drawing a line at this level. It will only draw lines for candles that match your chosen criteria (up or down candles), ensuring the chart remains clean and relevant to your trading strategy. Lines are automatically removed as soon as price crosses them.
Industry Indices ComparisonA dynamic industry sector performance comparison indicator that helps traders and investors track relative strength across different market sectors in real-time.
- Compares up to 5 industry sector ETFs against a benchmark index (default: SPY)
- Displays key metrics including:
* Performance % over selected timeframe
* Relative performance vs benchmark
* Trend direction (▲ up, ▼ down, − neutral)
* Volume in millions (M) of shares traded
- Configurable timeframes: 1D, 1W, 1M, and 3M comparisons
- Color-coded performance indicators (green for outperformance, red for underperformance)
- Customizable table position and text size for optimal chart placement
The indicator helps identify:
1. Sector rotation patterns through relative performance
2. Leading and lagging sectors vs the broader market
3. Volume trends across different sectors
For traders, if you are considering two equally good setups, then choosing the setup belonging to a currently strong sector could be beneficial.

ROC with closed based coloring & info table [DB]Rate of Change (ROC) Basics
The Rate of Change (ROC) is a momentum oscillator measuring the percentage price change between the current close and the close from N periods ago.
Calculated as: ROC = * 100
Traders use ROC to:
Identify overbought/oversold conditions
Spot momentum shifts
Confirm trend strength
My improvements:
Visual Clarity
Color-Coded Direction: ROC line changes color (green/red/yellow) based on intra-candle momentum shifts.
Direction Table: Instant view of the last change in ROC with the candle close (▲ UP / ▼ DOWN / ▶ FLAT).
Cells for current value and previous change between timeframe bar period.
What you can benefit with this over the regular ROC:
Faster Analysis: The visual cues make direction and strength instantly obvious and it allows for faster decision making while preserving more mental capital.

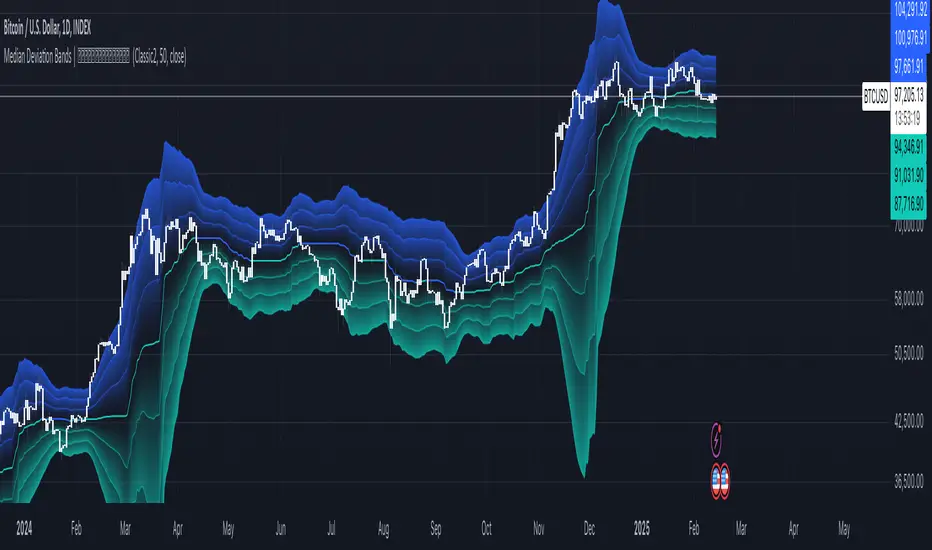
Median Deviation Bands | QuantumResearchIntroducing QuantumResearch’s Median Deviation Bands Indicator
The Median Deviation Bands indicator is an advanced volatility-based tool designed to help traders identify price trends, market reversals, and potential trading opportunities.
By using a percentile-based median baseline combined with standard deviation bands, this indicator provides a dynamic framework for analyzing price movements and assessing market volatility.
How It Works
Baseline Calculation:
The median price over a user-defined period (default: 50) is calculated using the 50th percentile of price data.
This serves as the central reference point for trend analysis.
Trend Identification:
Bullish Trend: Occurs when the price crosses above the baseline.
Bearish Trend: Occurs when the price crosses below the baseline.
Deviation Bands:
The indicator plots three sets of upper and lower bands, representing 1x, 2x, and 3x standard deviations from the median.
These bands act as dynamic support and resistance zones, helping traders identify overbought and oversold conditions.
Visual Representation
The Median Deviation Bands indicator offers a clear, customizable visual layout:
Color-Coded Baseline:
Green (Bullish): Price is above the median.
Red (Bearish): Price is below the median.
Deviation Bands:
First Band (Light Fill): Represents 1 standard deviation from the baseline.
Second Band (Medium Fill): Represents 2 standard deviations, highlighting stronger trends.
Third Band (Dark Fill): Represents 3 standard deviations, showing extreme price conditions.
Trend Markers:
Green Up Arrows: Indicate the start of a bullish trend when price crosses above the baseline.
Red Down Arrows: Indicate the start of a bearish trend when price crosses below the baseline.
Customization & Parameters
The Median Deviation Bands indicator includes multiple user-configurable settings to adapt to different trading strategies:
Baseline Length: Default set to 50, determines the lookback period for median calculation.
Source Price: Selectable input price for calculations (default: close).
Band Visibility: Traders can toggle individual deviation bands on or off to match their preferences.
Trend Markers: Option to enable or disable up/down trend arrows.
Color Modes: Choose from eight color schemes to customize the indicator’s appearance.
Trading Applications
This indicator is highly versatile and can be applied to multiple trading strategies, including:
Volatility-Based Trading: Price movement within and outside the bands helps traders gauge volatility and market conditions.
Trend Following: The baseline and deviation bands help confirm ongoing trends.
Mean Reversion Strategies: Traders can look for price reactions at extreme bands (±3 standard deviations).
Final Note
QuantumResearch’s Median Deviation Bands indicator provides a unique approach to market analysis by integrating percentile-based median price levels with standard deviation-based volatility bands.
This combination helps traders understand price behavior in relation to historical volatility, making it a valuable tool for both trend-following and mean-reversion strategies.
As always, backtesting and customization are recommended to optimize performance across different market conditions.
Volume Delta with Bollinger Bands [EMA]TL;DR
This indicator displays a “Volume Delta” candle chart based on a lower timeframe approximation of up vs. down volume. Bollinger Bands (using an EMA and a configurable standard deviation multiplier) highlight when Volume Delta exceeds typical volatility thresholds. Green bars will darken when Volume Delta is above the upper Bollinger band, and red bars will darken when Volume Delta is below the lower Bollinger band. You can optionally include wicks in the Bollinger calculations. Note : TradingView uses tick-based volume data, so these values may not precisely match true market orders.
What Is Volume Delta ?
• Volume Delta is a metric that identifies buying vs. selling activity in a market by distinguishing between orders transacting at the ask (buy volume) and orders transacting at the bid (sell volume).
• A positive Volume Delta indicates more buy volume during a bar, while a negative Volume Delta indicates more sell volume.
How TradingView Calculates Volume Delta
• TradingView relies on tick data to approximate up/down volume. This may not perfectly capture true order-flow distribution, particularly on higher timeframes or illiquid symbols.
• While it can provide useful insights into volume flow, keep in mind the underlying data’s limitations.
Key Features of This Indicator
1. Automatic or Custom Lower Timeframe Data
• The script can automatically select a lower timeframe for Volume Delta, or you can manually specify one in the settings.
2. Bollinger Bands on Volume Delta
• Uses an EMA of the Volume Delta (or a wick-based average) and calculates a standard deviation.
• The upper and lower bands highlight when activity deviates from typical volatility.
3. Configurable Wick Inclusion
• Decide whether to use only the “close” (lastVolume) of the Volume Delta bar or the average of its wicks ((maxVolume + minVolume) / 2) for Bollinger calculations.
4. Dynamic Bar Colors
• Positive Volume Delta bars turn dark green if they exceed the upper Bollinger band, otherwise lighter green .
• Negative Volume Delta bars turn dark red if they fall below the lower Bollinger band, otherwise lighter red .
How To Use
1. Add the Indicator to Your Chart
• Apply it to any symbol and timeframe in TradingView.
• Configure the lower timeframe for Volume Delta if desired.
2. Adjust Bollinger Settings
• Bollinger Length defines the EMA and standard deviation period.
• Bollinger Multiplier sets how far the bands lie from the EMA.
3. Choose Whether To Use Wicks
• Toggle to use the average of high/low for a potentially more volatile reading.
• Turn it off to rely solely on the Volume Delta “close.”
4. Interpret the Signals
• Dark Green Above the Upper Band : Suggests strong buying pressure above normal.
• Lighter Green : Positive but within typical volatility bounds.
• Dark Red Below the Lower Band : Suggests strong selling pressure below normal.
• Lighter Red : Negative but within typical volatility.
Important Caveats
• TradingView Volume Data : Tick-based and aggregated data may not reflect actual order-flow precisely.
• Context Matters : Combine Volume Delta with other forms of analysis (price action, support/resistance, etc.) to form a more comprehensive strategy.
ZenAlgo - UltimateThe ZenAlgo - Ultimate Indicator is a premium trading tool that integrates advanced sub-indicators into a single framework, combining volume analysis, divergence detection, and market sentiment visualization. Designed for traders seeking deeper insights, it addresses the limitations of standalone free indicators by delivering a cohesive system that enhances accuracy, adaptability, and decision-making.
Why Multiple Sub-Indicators?
The integration of sub-indicators into one tool provides unique benefits not achievable with individual free indicators:
Improved Accuracy: Combining volume trends, delta volume, and divergence detection creates a multi-dimensional view of market behavior, reducing the chance of false signals.
Synergistic Insights: Free indicators like MAs or divergences work independently, while this tool integrates them into a unified framework that highlights actionable patterns, improving signal reliability.
Actionable Combinations: The tool visually aligns multi-timeframe trends, divergences, and volume states, enabling traders to confirm trades using multiple metrics in one glance, saving time and enhancing precision.
Features
This indicator introduces several customizations and integrations that distinguish it from free alternatives:
Dynamic Volume Classification: It calculates and categorizes volume states into clear signals like "Mega Buy" or "Big Sell," providing instant clarity about unusual activity levels.
Enhanced Delta Volume Analysis: Tracks delta volume trends with adjustable sensitivity, identifying subtle shifts in market pressure that standalone delta indicators might miss.
Customizable Multi-Timeframe Volume Tables: Displays volume and delta metrics across multiple timeframes, offering a holistic view of market activity that helps align short- and long-term strategies.
Real-Time Alerts: Provides instant notifications for confirmed and unconfirmed delta volume crosses, helping users stay ahead of market movements.
Divergence Detection Across Metrics: Identifies regular and hidden bullish or bearish divergences using up, down, and delta volumes, integrating price fractals for added precision.
How It Works
1. Volume and Delta Volume Integration
The indicator calculates and categorizes volume activity into specific states, such as "Mega Buy" or "Big Sell," by comparing the current volume with its 20-period average. For delta volume, it tracks the difference between buying and selling pressure, identifying shifts in market sentiment. These calculations are dynamically updated across multiple timeframes, with delta trends smoothed using user-selected moving averages (e.g., SMA, EMA, WMA, HMA) to highlight sustained market pressure changes.
2. Multi-Timeframe Volume Tables
The tool aggregates and displays volume and delta volume data across various timeframes in a visual table. Each timeframe's data includes total volume, categorized buying and selling volumes, and the net delta volume. Colors within the table provide immediate insights into the prevailing market sentiment for each timeframe, with bullish or bearish conditions emphasized using pre-defined thresholds.
3. Divergence Detection Across Metrics
Divergences are identified using fractal patterns in up volume, down volume, and delta volume. Regular and hidden bullish or bearish divergences are detected by comparing historical volume peaks and troughs with corresponding price movements. This allows the tool to highlight potential reversals or trend continuations before they are visually apparent on the chart.
4. Market State Labels
The indicator synthesizes multiple metrics, such as volume trends, delta volume movements, and histogram direction, to generate actionable market state labels. These labels, such as "Bullish," "Bearish," or "Reversal," offer a high-level summary of current market conditions, helping traders quickly adapt their strategies.
5. Real-Time Alerts
To ensure traders stay informed, the tool includes alerts for confirmed and unconfirmed delta volume crosses. These alerts consider not only the delta volume's movement relative to its average but also whether the broader buying or selling pressure supports the signal, enhancing the reliability of the alerts.
Specific Scenarios Where This Indicator Excels
Trend Confirmation: Align rising delta volume with bullish divergences across timeframes for high-confidence entries.
Reversal Identification: Use divergence labels to anticipate trend reversals before they occur.
Market Sentiment Analysis: Dynamic candle coloring helps visualize whether the market is dominated by bullish or bearish forces.
Volume Breakout Detection: Track spikes in cumulative volume and delta volume to identify breakouts with higher accuracy.
When to Be Cautious
Low-Volume Markets: In thinly traded markets, signals like divergences or delta volume shifts may produce noise due to insufficient data.
Highly Volatile Conditions: Sudden volume spikes can result in false positives for breakouts or reversals.
Session Overlaps or Data Misalignment: Variations in session timings or data discrepancies can temporarily impact cumulative volume metrics.
Overfitting Sensitivity Settings: Excessively high sensitivity settings may overfit the indicator to specific market conditions, leading to unreliable signals in broader contexts.
Why Pay for This Indicator?
This tool stands out because it doesn’t merely replicate free indicators; it integrates and enhances them into a uniquely actionable framework:
Tailored for Precision: Adjustable parameters for sensitivity, divergence detection, and timeframe analysis allow traders to adapt the indicator to their strategies.
Time-Saving Synergy: Combines the functionality of multiple tools into a single interface, eliminating the need to juggle multiple scripts.
Comprehensive Insights: Delivers a broader perspective by linking volume trends, delta volume, and divergences, ensuring more informed decisions.
Real-Time Notifications: Alerts for key events ensure you never miss a critical market movement.
Usage Examples
Volume State Monitoring: Instantly identify states like "Big Buy" or "Mega Sell" to act on significant volume surges.
Multi-Timeframe Alignment: Combine bullish divergences on a 15-minute chart with a rising daily delta volume trend for high-probability trades.
Scalping Opportunities: Use delta volume crosses and short-term trends for quick entries and exits.
Breakout Validation: Confirm volume breakouts with delta volume spikes to avoid false signals.
Settings
Volume MA Length: Adjusts the moving average period for volume trends.
Divergence Sensitivity: Fine-tunes the thresholds for divergence detection to suit different market conditions.
Multi-Timeframe Visibility: Customizes the number of timeframes displayed in the cumulative volume table.
Conclusion
The Ultimate Indicator is more than a collection of sub-indicators—it’s a fully integrated system designed to address the limitations of standalone tools. By offering deeper insights into volume trends, market sentiment, and divergence analysis, it empowers traders to make better-informed decisions with enhanced confidence.

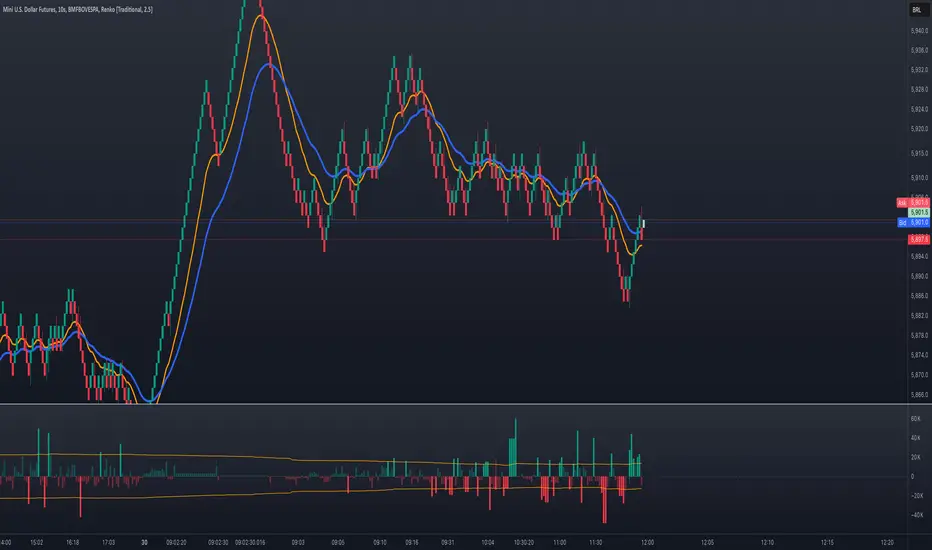
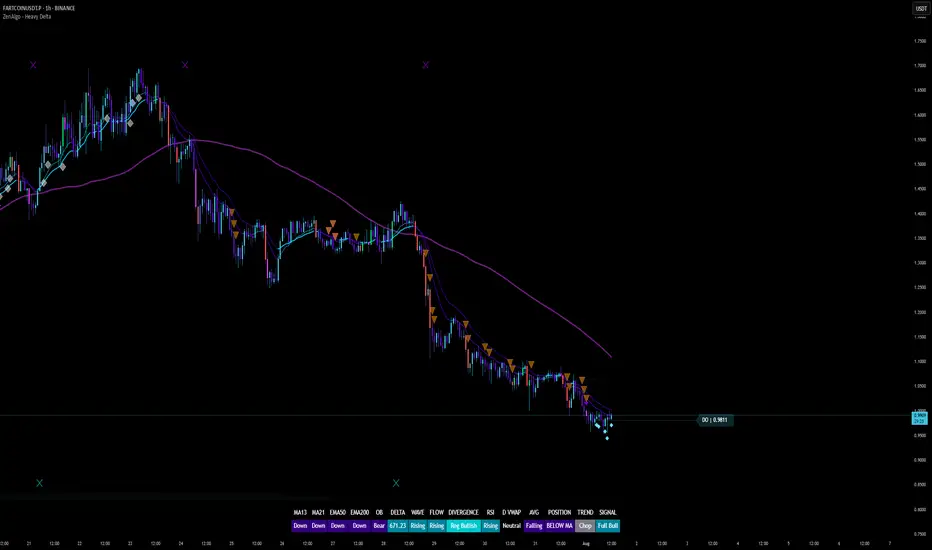
ZenAlgo - Heavy DeltaThe ZenAlgo - Heavy Delta indicator is a comprehensive technical analysis tool designed for traders seeking a deeper understanding of market dynamics. It combines multiple advanced sub-indicators, including Order Blocks, Moving Averages, VWAP, and Delta Volume analysis, and more to provide actionable insights. This indicator is particularly useful for identifying potential trade entries and exits based on institutional order flow and price action patterns.
Features
Order Block Detection: Identifies bullish and bearish order blocks with detailed visualization and volume analysis.
VWAP (Volume Weighted Average Price): Tracks the average price of a security weighted by volume over various anchor periods.
Moving Averages (MA): Customizable MAs (13, 21, 50, 200 periods) to detect trends and momentum shifts.
Daily Open and Monday Range: Highlights key levels like daily open and intraday/multi-day high-low ranges for better price context.
Delta Volume Analysis: Measures the net difference between buying and selling volume for market sentiment insights.
Divergence Detection: Detects regular and hidden bullish/bearish divergences for trend reversal opportunities.
Visual Alerts: Displays intuitive symbols for potential buy/sell signals and key price levels.
Added Value: Why Is This Indicator Original/Why Shall You Pay for This Indicator?
The ZenAlgo - Heavy Delta indicator offers a distinct advantage by integrating multiple analysis techniques into one cohesive tool. While many individual indicators are freely available, this script goes beyond simple overlays to provide an advanced analytical framework. Here’s why it stands out:
1. Synergy of Indicators
Order Blocks: These are not static; the indicator dynamically calculates zones where institutional activity likely occurred, supported by volume-weighted metrics.
Delta Volume Analysis: Freely available delta volume tools typically show raw data, but this script filters noise, categorizes volume into meaningful up/down segments, and integrates it with other signals for context.
VWAP and Moving Averages: VWAP and customizable MAs are enhanced with divergence checks, color-coded trends, and market state classifications. This integration helps confirm trends and reversals with higher precision.
2. Volume-Based Insights
Traditional volume indicators often fail to show the "intent" behind price moves. This script combines delta volume and order block data to highlight areas of significant buying or selling pressure and their potential impacts on future price action.
3. Visual Simplicity with Advanced Logic
Unlike using several separate tools, which can clutter your chart, this indicator presents a streamlined interface. Every plotted element serves a clear purpose, minimizing distractions while maximizing actionable insights.
4. Customized for Active Traders
The indicator doesn’t just provide standard calculations. It includes proprietary adjustments like mitigation thresholds in order blocks, percentage-based signals for VWAP, and delta volume intensity levels that align better with active market conditions.
5. Why Pay for It?
Time and effort savings: Instead of setting up and calibrating multiple tools, this indicator combines them into a single efficient package.
Enhanced accuracy: Each sub-indicator validates the others, reducing false signals.
Unique features: For instance, the script automatically adjusts for multi-timeframe inconsistencies and uses gradient color fills to convey volume strength in order blocks—a feature absent in free indicators.
How It Works
The indicator combines individual sub-indicators into a logical framework where each part contributes to the overall analysis. Here’s how each feature operates:
1. Order Blocks
Identification: Uses specific price action patterns to locate zones of likely institutional interest (bullish or bearish blocks).
Dynamic Updates: The blocks adjust as new price data comes in, ensuring their relevance. Volume within these zones is weighted, helping assess their strength and potential price reactions.
Visual Enhancements: Blocks are color-coded and filled with gradients based on volume intensity, providing immediate visual cues about their importance.
2. VWAP (Volume Weighted Average Price)
Calculation: Anchored to user-selected periods (daily, weekly, etc.), VWAP is recalculated in real-time, showing the "fair" price based on traded volume.
Integration: Acts as a dynamic support/resistance line, particularly useful in intraday and swing trading. Labels provide percentage deviation for quick interpretation.
3. Moving Averages (MAs)
Customization: Supports various types (EMA, SMA, etc.) and lengths (13, 21, 50, 200). Traders can configure these to suit their strategies.
Market Status: By comparing the price to these MAs, the indicator classifies the market as Full Bull, Bullish, Neutral, Bearish, or Full Bear. This high-level summary helps traders quickly gauge market sentiment.
4. Delta Volume
Core Logic: Calculates the net difference between buying and selling pressure (volume) for each candle.
Visual Signals: Plots symbols when significant delta volume changes coincide with other indicator signals, like divergence or order block activity.
5. Daily Open and Monday Range
Purpose: Identifies key psychological levels like the daily open and the high/low range for the first trading day of the week.
Context: Highlights these levels with dynamic percentage changes, helping traders understand how price is behaving relative to them.
6. Divergence Detection
Logic: Tracks discrepancies between price movement and momentum (via Moving Averages, Delta Volume, and Order Blocks). These divergences often precede reversals.
Validation: Divergences are only flagged when other features, like delta volume shifts or order block interactions, confirm the setup.
By combining these tools in a meaningful way, ZenAlgo - Heavy Delta transforms raw data into actionable intelligence, giving traders a comprehensive view of market dynamics and a significant edge in decision-making.
Why Use Heikin Ashi for Heavy Delta?
The ZenAlgo - Heavy Delta indicator is optimized for Heikin Ashi (HA) candles, which smooth out market noise and make trends more visually apparent. Heikin Ashi works best for this strategy for several key reasons:
Why Heikin Ashi Works Best
Trend Clarity: Unlike traditional candlesticks, Heikin Ashi averages price data to create smoother transitions. This helps the indicator better identify sustained trends and reduces false signals caused by short-term price fluctuations.
Noise Reduction: HA candles filter out minor fluctuations and emphasize the overall market direction, making it easier to align the indicator’s signals (like Delta Volume and Order Blocks) with larger market movements.
Improved Visual Insights: Features like Order Blocks and Delta Volume align well with Heikin Ashi's smoothed representation, as it avoids the erratic movements that traditional candles sometimes display.
Better Support for Trend Strategies: Heikin Ashi candles naturally highlight key reversals and continuation patterns, which complement the analytical goals of this indicator.
Important Notes About Heikin Ashi:
Synthetic Nature of HA Candles: Heikin Ashi values are calculated differently than traditional candles. For example: a) The open is the average of the prior candle's open and close. b) The close is the average of the high, low, open, and close. This synthetic nature means that HA candles do not reflect actual market prices but rather smoothed averages, which can slightly lag real-time price movements.
Lagging Effect: Because HA candles use averaged data, they can lag behind actual price action. This is beneficial for identifying trends but less effective for precise entry/exit timing.
Inaccuracy in Low Volatility: In low-volume or low-volatility conditions, HA candles may distort actual price dynamics, leading to less reliable insights.
No Direct Alerts or Buy/Sell Signals : Issuing explicit buy or sell signals based on Heikin Ashi candles is not possible due to their averaged, synthetic nature. As such, the ZenAlgo - Heavy Delta indicator does not generate direct trading signals. Instead, the indicator is a decision-support tool that provides insights into trends, volume dynamics, and potential key levels, leaving trade execution to the trader's discretion.
Usage Examples
Trend Confirmation: Use the MA market status to identify if the market is in a Full Bull or Bear state.
Reversal Zones: Monitor order block zones for price rejection or absorption, signaling a potential reversal.
Breakout Trading: Trade breakouts when price surpasses VWAP or Monday Range highs/lows.
Delta Divergence: Look for positive/negative delta volume divergences during consolidations for breakout cues.
Mean Reversion: Use VWAP or MAs as dynamic support/resistance for mean reversion setups.
Intraday Scalping: Utilize daily open and intraday levels for short-term trades.
Swing Trading: Employ order blocks and multi-day ranges to frame swing trade setups.
Volume Climax: Identify volume spikes using Delta Volume to confirm trend continuation or reversal.
Momentum Trading: Combine divergence signals with Delta Volume for high-conviction entries.
Risk Management: Use defined order block boundaries to set stop losses and targets.
Settings
Order Blocks: Customize label visibility, label offsets, and block appearance.
VWAP: Adjust anchor period and toggle visibility.
Moving Averages: Configure length, type (EMA, SMA, etc.), and visibility of MAs (13, 21, 50, 200).
Delta Volume: Enable/disable delta symbols and labels, adjust sensitivity multipliers.
Daily Open/Monday Range: Toggle visibility and customize display preferences.
General Visuals: Adjust label offsets, color schemes, and transparency.
Important Notes
This indicator is a technical analysis tool and does not guarantee trading success.
Use it in conjunction with other indicators and fundamental analysis for a more comprehensive trading strategy.
Performance may vary in low-liquidity markets or during sudden news events.
Divergence signals might fail in strongly trending markets.
AI InfinityAI Infinity – Multidimensional Market Analysis
Overview
The AI Infinity indicator combines multiple analysis tools into a single solution. Alongside dynamic candle coloring based on MACD and Stochastic signals, it features Alligator lines, several RSI lines (including glow effects), and optionally enabled EMAs (20/50, 100, and 200). Every module is individually configurable, allowing traders to tailor the indicator to their personal style and strategy.
Important Note (Disclaimer)
This indicator is provided for educational and informational purposes only.
It does not constitute financial or investment advice and offers no guarantee of profit.
Each trader is responsible for their own trading decisions.
Past performance does not guarantee future results.
Please review the settings thoroughly and adjust them to your personal risk profile; consider supplementary analyses or professional guidance where appropriate.
Functionality & Components
1. Candle Coloring (MACD & Stochastic)
Objective: Provide an immediate visual snapshot of the market’s condition.
Details:
MACD Signal: Used to identify bullish and bearish momentum.
Stochastic: Detects overbought and oversold zones.
Color Modes: Offers both a simple (two-color) mode and a gradient mode.
2. Alligator Lines
Objective: Assist with trend analysis and determining the market’s current phase.
Details:
Dynamic SMMA Lines (Jaw, Teeth, Lips) that adjust based on volatility and market conditions.
Multiple Lengths: Each element uses a separate smoothing period (13, 8, 5).
Transparency: You can show or hide each line independently.
3. RSI Lines & Glow Effects
Objective: Display the RSI values directly on the price chart so critical levels (e.g., 20, 50, 80) remain visible at a glance.
Details:
RSI Scaling: The RSI is plotted in the chart window, eliminating the need to switch panels.
Dynamic Transparency: A pulse effect indicates when the RSI is near critical thresholds.
Glow Mode: Choose between “Direct Glow” or “Dynamic Transparency” (based on ATR distance).
Custom RSI Length: Freely adjustable (default is 14).
4. Optional EMAs (20/50, 100, 200)
Objective: Utilize moving averages for trend assessment and identifying potential support/resistance areas.
Details:
20/50 EMA: Select which one to display via a dropdown menu.
100 EMA & 200 EMA: Independently enabled.
Color Logic: Automatically green (price > EMA) or red (price < EMA). Each EMA’s up/down color is customizable.
Configuration Options
Candle Coloring:
Choose between Gradient or Simple mode.
Adjust the color scheme for bullish/bearish candles.
Transparency is dynamically based on candle body size and Stochastic state.
Alligator Lines:
Toggle each line (Jaw/Teeth/Lips) on or off.
Select individual colors for each line.
RSI Section:
RSI Length can be set as desired.
RSI lines (0, 20, 50, 80, 100) with user-defined colors and transparency (pulse effect).
Additional lines (e.g., RSI 40/60) are also available.
Glow Effects:
Switch between “Dynamic Transparency” (ATR-based) and “Direct Glow”.
Independently applied to the RSI 100 and RSI 0 lines.
EMAs (20/50, 100, 200):
Activate each one as needed.
Each EMA’s up/down color can be customized.
Example Use Cases
Trend Identification:
Enable Alligator lines to gauge general trend direction through SMMA signals.
Timing:
Watch the Candle Colors to spot potential overbought or oversold conditions.
Fine-Tuning:
Utilize the RSI lines to closely monitor important thresholds (50 as a trend barometer, 80/20 as possible reversal zones).
Filtering:
Enable a 50 EMA to quickly see if the market is trading above (bullish) or below (bearish) it.

Power Trend Screener [LevelUp]Screen for symbols in a Power Trend using the Pine Screener. This screener supports all equity types from stocks to ETFs to crypto.
When a Power Trend is active, there is a stronger than usual uptrend underway. The concept of a Power Trend was created by Investor's Business Daily to mimic the trading style of IBD's Founder and legendary trader, William O'Neil.
🔹 What Starts A Power Trend?
✓ Low is above the 21-day EMA for at least 10 days.
✓ 21-day EMA is above the 50-day SMA for at least five days.
✓ 50-day SMA is in an uptrend.
✓ Close up for the day.
🔹 What Ends A Power Trend?
✓ 21-day EMA crosses under 50-day SMA.
✓ Close 10% below recent high and below the 50-day SMA.
🔹 Screening Features - Setting Your Search Criteria
There are various search options that can be customized to meet your preferences.
▪ In A Power Trend
To cast the widest net, select only this option and all stocks in a Power Trend will be returned.
▪ Power Trend Started
This option will search for symbols that began a Power Trend on the most recent daily bar.
▪ Power Trend Ended
This option will search for symbols where there was an active Power Trend, however, it ended on the most recent daily bar.
▪ Days In A Power Trend
This option can be helpful if you would like to find stocks that recently entered a Power Trend, for example, stocks that have been in a Power Trend for less than 5 days. Another use would be to search for stocks where the Power Trend has been active for a longer period of time, for instance, over 50 days.
▪ 1 Week % Change
With this option you can search for stocks that are up/down a specific percentage over the past week. For example, search for stocks in a Power Trend that are up 5% or more in the past week.
▪ 1 Month % Change
Similar to the above, narrow the search to percent changes based on monthly data. For example, return stocks in a Power Trend that are down 10% or more in the past month.
▪ Limit Symbol Types
If you have a watchlist that has multiple symbol types, for example stocks and crypto, you can set this option to limit the search to one or more symbol types. You can configure this option by clicking the drop-down to the right of the indicator name and selecting Settings.
🔹 Installation And Usage
▪ Mark this indicator as a Favorite.
▪ Use the Pine Screener to search for Power Trends.
▪ Save the search results to a watchlist.
▪ View the watchlist in TradingView.
🔹 Power Trend Indicator
This screener is designed to be used along with the Power Trend indicator to view Power Trends on your chart.
🔹 Important Notes
▪ This indicator is for screening, there is no visible output on the chart.
▪ Once you mark this screener as a Favorite, you can remove it from your chart.
▪ The Power Trend concept as defined by Investor's Business Daily is based on moving averages on the daily timeframe. Given this requirement, this screener is also limited to searching the same timeframe.

NSE & BSE Option Chain - Auto Option Data InputDefinition
An options chain is a list of all available option contracts for a specific security, organized by expiration date and strike price.
What Is an Options Chain ?
Understanding how to read and analyze options chains is crucial for investors venturing into options trading. These display all available option contracts for a particular security, typically in a table format that organizes contracts by expiration date and strike price. The tool provides a wealth of information at a glance, including present prices, trading volume, and implied volatility (IV) for both call and put options.
While the long list of prices and other information can look at first to be overly complicated, learning to navigate an options chain will significantly improve your ability to trade in these derivatives and identify prospects in the market. As options continue to gain popularity among retail investors, mastering the intricacies of the options chain has become an essential skill for those looking to expand their trading strategies beyond traditional stock investments.
Key Takeaways
An options chain displays all available option contracts for a security, organized by expiration date and strike price.
Options chains typically show each contract's bid price, ask price, volume, open interest, and implied volatility (IV).
Options chains can be used to identify trading prospects, such as mispriced options or favorable risk-reward scenarios.
Understanding Options Chains
Option chains list all available option contracts for a particular underlying security. For traders, they provide a snapshot of crucial information about each contract, including strike prices, expiration dates, and market prices.
Typically organized in a table, options chains have separate sections for call and put options. The rows represent different strike prices, while the columns show various data points for each contract. This lets traders quickly compare options with different characteristics to make informed decisions.
Decoding Options Chains
The columns of an option chain, as seen in the example chart above, include the following:
Strike price: The price the option holder can buy (for calls) or sell (for puts) the underlying asset.
Expiration date: The last day the option contract is valid.
1
Bid price: The highest price a buyer is willing to pay for the option.
Ask price: The lowest price a seller is willing to accept for the option.
Last price: The most recent trading price for the option.
Percentage change: The net change column reflects the direction (up, down, or flat) for the underlying asset, as well as the amount of the price shift.
Volume: The number of contracts traded during the current session.
2
Open interest: The total of outstanding contracts.
Mastering the art of reading options chains is essential for any serious options trader. It's where market sentiment, price inefficiencies, and trading prospects all come together.
In options trading, information is power. A well-analyzed option chain can reveal market inefficiencies that savvy traders can exploit. For example, comparing the bid-ask spread across different strike prices can help identify more liquid options, while analyzing open interest can help you understand market sentiment.
A skilled user can quickly decipher an options chain for what it says about price moves and where there are high and low levels of liquidity. For the best trades, this is critical information. For those not quite there yet, let's break down other parts of the options chain tables into manageable parts:
Calls vs. puts: Option chains typically separate call options (the right to buy) from put options (the right to sell). This division allows traders to focus straightaway on bullish or bearish strategies.
Filters and customization: Most trading platforms enable you to customize your options chain view. You can quickly filter by expiration date, strike price range, or specific Greek values to focus on the most relevant contracts.
The Bottom Line
The options chain is indispensable for options traders, providing a comprehensive view of all available contracts for a given security. By learning to read and analyze options chains, you can gain greater clarity about market sentiment, identify trading prospects, and make more informed decisions for your options strategies.
While it takes a bit of time to become proficient in interpreting all the data presented, mastering the options chain is crucial for those looking to leverage the full potential of options trading in their investment approaches.
Fully Auto Option Data Input for All Currently Available NSE Indices and Stock & BSE Sensex Indices
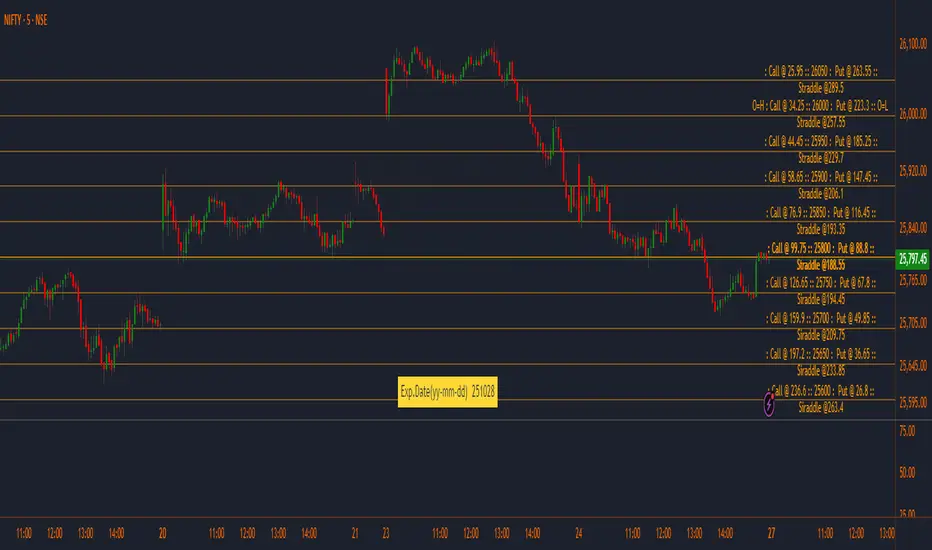
Adaptive Trend Finder - Pulse Frequency(Basic)The Adaptive Pulse Frequency & Amplitude Trend Indicator is a Pine Script-based tool designed for lower timeframe volume analysis and trend detection. By analyzing volume dynamics and identifying significant "pulses" in market activity, this indicator provides insights into bullish and bearish trends. Here's an overview of its key features and components:
1. Lower Timeframe Volume Analysis
Custom Timeframe Input: The indicator scans lower timeframe data to approximate Up/Down volume, with an optional override to set a custom timeframe.
Volume Delta Calculation: Tracks changes in volume (deltaVolume), representing the difference between up and down volume for each bar.
2. Adaptive Pulse Detection
Rolling Percentile Threshold: Dynamically calculates a threshold based on the pulsePercentile of the absolute delta volume within a specified lookback period (pulseLookback).
Pulse Identification: Bars where the absolute delta volume exceeds the adaptive threshold are classified as "pulses," indicating significant market activity.
Bullish Pulse: Positive delta volume exceeding the threshold.
Bearish Pulse: Negative delta volume exceeding the threshold.
3. Frequency & Amplitude Analysis
Pulse Frequency: Measures the number of bullish or bearish pulses within a rolling window (freqLookback), providing insights into the activity level.
Pulse Amplitude: Computes the cumulative volume delta for bullish and bearish pulses over a defined period (ampLookback), offering a finer view of market strength:
Bullish Amplitude: Sum of positive delta volume for bullish pulses.
Bearish Amplitude: Sum of absolute delta volume for bearish pulses.
4. Trend Logic
Trend Classification:
Bullish Trend: Higher bullish pulse frequency and amplitude.
Bearish Trend: Higher bearish pulse frequency and amplitude.
Neutral Trend: Mixed or inconclusive signals.
Advanced Metrics: Combines frequency and amplitude for robust trend assessment.
5. Visualization
Dynamic Threshold: Plots the adaptive threshold for real-time pulse detection.
Trend Visualization: Colors the chart background based on the identified trend (Bullish, Bearish, Neutral).
Amplitude and Frequency Lines: Displays separate plots for:
Net Frequency (Bullish - Bearish pulses).
Net Amplitude (Bullish amplitude - Bearish amplitude).
Individual bullish and bearish amplitudes for reference.
Use Case
This indicator is ideal for traders seeking to:
Analyze market activity on lower timeframes.
Identify shifts in bullish/bearish momentum through volume dynamics.
Enhance trend-following strategies with adaptive frequency and amplitude metrics.
With its focus on precision and adaptability, the Adaptive Pulse Frequency & Amplitude Trend Indicator is a powerful tool for volume-based market analysis.

Continuous Multi-Factor Trend Oscillator with Rolling Liquidity
// **Overview**
This script generates a *Continuous Multi-Factor Trend Oscillator* that integrates multiple market dynamics, including **long-term trends**, **short-term trends**, **volume adjustments**, **volatility factors**, **ADX trend strength**, and **rolling liquidity**. The result is a smooth, dynamic oscillator that reflects comprehensive market conditions.
### **Key Features**
1. **Long-Term Trend Score (LT Score)**: Measures the deviation of price from its EMA, normalized by standard deviation. Captures broad trend direction.
2. **Short-Term Trend Score (ST Score)**: Evaluates the slope of a short-period EMA, normalized by ATR, to reflect shorter-term momentum.
3. **Volume Adjustment**: Adjusts trend scores based on the relative volume compared to its moving average.
4. **Volatility Adjustment**: Incorporates ATR into the scoring system, penalizing or boosting scores based on current volatility compared to historical norms.
5. **ADX Trend Strength**: Uses ADX to identify trend strength, scaling scores positively or negatively depending on whether the market is trending or ranging.
6. **Rolling Liquidity**: Analyzes persistent buying or selling pressure by aggregating net buy/sell liquidity over a rolling lookback period.
### **Calculation Workflow**
- **Inputs**: Configurable parameters like long/short periods, ATR period, ADX smoothing, and volume lookback.
- **Trend Scores**: LT and ST scores are computed separately to capture trend dynamics across different timeframes.
- **Adjustments**: Volume, volatility, ADX, and rolling liquidity adjustments are calculated and scaled appropriately.
- **Final Oscillator**: Combines all scores into a single value and applies smoothing for clarity.
### **How It Works**
1. *Long-Term and Short-Term Trends*: Trend scores are calculated based on EMAs and normalized using standard deviation or ATR.
2. *Volume and Liquidity Factors*: Incorporates net up/down volume and liquidity to reflect market participation levels.
3. *ADX Strength*: Distinguishes trending vs. ranging markets, influencing the oscillator direction accordingly.
4. *Final Output*: All factors are combined into a single oscillator, smoothed using an EMA.
### **Visualization**
- The oscillator is plotted as a continuous line with dynamic scaling:
- **Above 75**: *Very Bullish*
- **Below -75**: *Very Bearish*
- **Threshold Levels (50/-50, 10/-10)**: Provide additional interpretative guidance.
- **Labels**: Displays sentiment at the last bar for quick reference (e.g., *Strongly Bullish*, *Neutral*).
### **Use Cases**
- Ideal for identifying market conditions (bullish, bearish, neutral) based on multiple factors.
- Can serve as a confirmation tool alongside price action or other indicators.
### **Customizable Parameters**
- All periods (e.g., long-term, short-term, ATR, ADX) and lookbacks are adjustable, allowing fine-tuning based on market behavior and trading preferences.
How to use:

[blackcat] L2 Six Round Positioning█ OVERVIEW
The script is an indicator designed to plot the direction (up, down, no change) of several moving averages (MA) on a separate chart, without overlaying the price data. It calculates Simple Moving Averages (SMA) for 3, 5, 8, 34, 60, 120, and 250 periods and uses conditional logic to determine the color and position of the plotted columns based on whether each MA is increasing, decreasing, or unchanged.
█ LOGICAL FRAMEWORK
The script is structured into three main sections:
1 — Input Parameters: None explicitly defined, but the script uses default settings for the indicator function.
2 — Calculations: Computes Simple Moving Averages (SMA) for seven different periods.
3 — Plotting: Uses conditional logic to plot columns representing the direction of each MA, with positions and colors indicating whether the MA is increasing, decreasing, or unchanged.
The flow of data is straightforward: the script calculates the SMAs, determines their direction, sets the appropriate color, and then plots the columns.
█ CUSTOM FUNCTIONS
• No custom functions are defined in this script. All calculations and plotting are done using built-in Pine Script functions such as ta.sma for SMA calculation and plot for plotting.
█ KEY POINTS AND TECHNIQUES
• Use of ta.sma: The script effectively uses the ta.sma function to calculate Simple Moving Averages for different periods.
• Conditional Logic: The script employs conditional logic (ternary operators) to determine the color and position of the plotted columns based on the direction of each MA.
• Plotting with plot: The plot function is used extensively to display the direction of each MA with different colors and positions.
• Color Transparency: The use of color.new with transparency (e.g., color.new(color.green, 50)) allows for visually distinct colors that are not too overpowering.
█ EXTENDED KNOWLEDGE AND APPLICATIONS
• Modifications: The script could be enhanced by adding input parameters to allow users to customize the periods of the moving averages, colors, and transparency levels.
• Extensions: Similar techniques could be applied to other types of moving averages (e.g., EMA, WMA) or to other technical indicators.
• Strategy Development: This indicator could serve as a component in a larger trading strategy by providing insights into the overall trend direction across multiple timeframes.
• Related Concepts: Understanding of moving averages, conditional logic, and plotting techniques in Pine Script would be beneficial for further development and customization of this script.

Sunil's Three 3 Inside Up Down IndicatorThree candlestick Pattern Bullish Reversal- Three Inside Up => Formed by a Bullish Harami pattern followed by a confirmation candle closing above the previous candle.
Three candlestick Pattern Bearish Reversal- Three Inside Down => Formed by a Bearish Harami pattern followed by a confirmation candle closing below the previous candle.
